
Concentration units underpin nearly every analytical result. Understanding what ppb ppm chemistry figures represent, and why laboratories select one scale over another, makes technical reports far easier to read. This guide covers how trace concentrations are measured, documented and compared across environmental science and analytical chemistry.
How are concentration units used in analytical chemistry?
Analytical chemistry expresses results in whichever unit best matches the measurement range. Parts-per notation dominates trace work because it is dimensionless and transfers cleanly between sample types, from aqueous solutions to soils to ambient air.
This standardisation matters enormously in regulatory contexts, where analytical results from multiple sources feed into a single compliance assessment. Without agreed concentration units, cross-laboratory comparison would require constant conversion and constant risk.
Why are trace concentrations important in environmental science?
Many substances exert biological effects at concentrations far below what older instruments could detect. Persistent organic pollutants, endocrine-active compounds and certain heavy metals fall into this category, which is why trace analysis has become central to environmental assessment.
“Detection capability has outpaced our understanding of what the numbers mean.”
Responsible environmental monitoring therefore reports detection alongside context, including relevant guideline values and the method’s quantification limit, rather than presenting bare numbers.
How are chemical substances reported at very low levels?
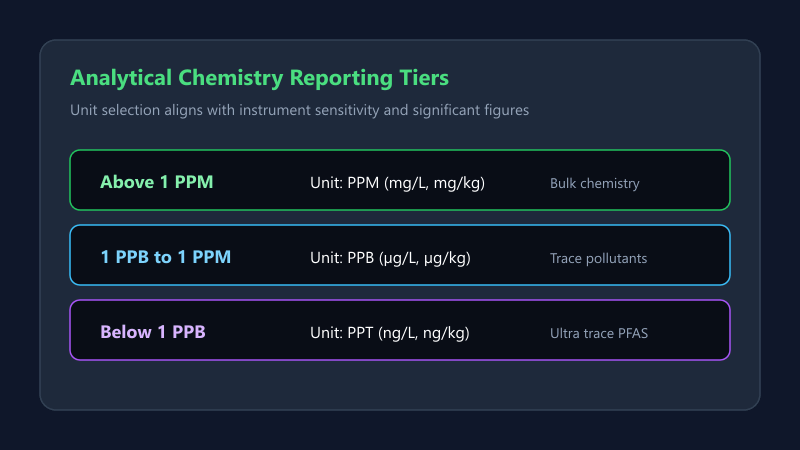
Below one ppm, most laboratories switch to ppb; below one ppb, to ppt. The convention keeps significant figures ahead of the decimal point and reduces transcription risk.
| Concentration range | Usual unit |
|---|---|
| Above 1 ppm | ppm |
| 1 ppb to 1 ppm | ppb |
| Below 1 ppb | ppt |
Alongside the figure, competent laboratory reporting includes the detection limit and often the measurement uncertainty. These qualifiers are as much a part of the analytical result as the number itself.
What types of samples may use PPB measurements?
Water samples dominate, but ppb reporting extends across many matrices. Soil and sediment analyses, ambient air monitoring, food residue testing and biological tissue studies all routinely produce results in this range.
| Sample type | Common ppb analytes |
|---|---|
| Groundwater | Metals, solvents |
| Soil | Pesticides, PAHs |
| Ambient air | VOCs, trace gases |
| Food | Residues, contaminants |
A chemical sample requiring extensive extraction may reach higher detection limits simply because of dilution during preparation, which affects how the final sample concentration should be interpreted.
How does concentration reporting support environmental monitoring?
Monitoring programmes depend on comparable data across time and location. Consistent concentration reporting allows results from different years and different laboratories to be combined into meaningful trend analyses.
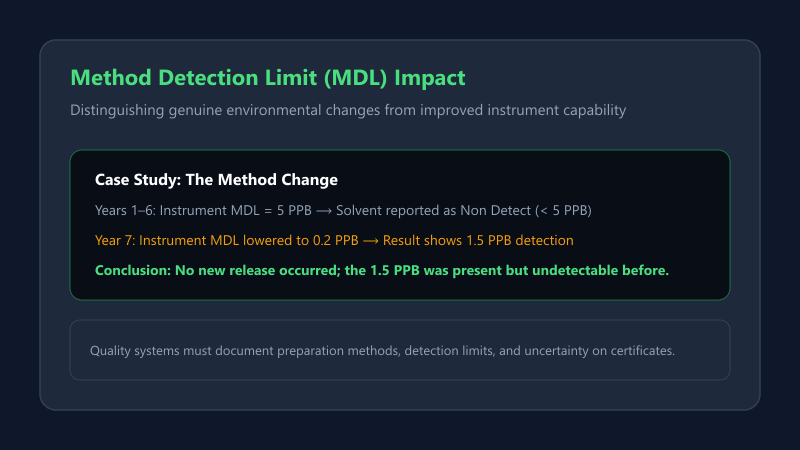
If a programme switches to a more sensitive technique midway through, apparent concentrations may rise simply because previously undetectable levels now register. Good environmental data management documents method changes explicitly alongside the results, so analysts can distinguish genuine environmental change from analytical improvement.
How are laboratory concentration results documented?
A complete laboratory result record includes far more than a number. Sample identification, collection date and time, preparation method, analytical technique, detection limit and the analyst’s identity all form part of the documentation.
If a result is challenged, the full chain from sampling through analysis must withstand scrutiny. Many laboratories operate under accreditation schemes that specify exactly what laboratory data must be retained and for how long, and these requirements shape how chemical analysis records are structured.
How can converted values improve comparison between reports?
Reports from different sources frequently use different units, which makes direct comparison unreliable. Converting everything to one unit before analysis is a necessary preliminary step, not an optional refinement.
Record the conversion explicitly when you perform it. A note stating that original values were reported in ppm and converted to ppb preserves traceability back to the source document.
What factors should be considered when interpreting concentration data?
Consider a soil result of 15 ppb for a given compound. Was the sample a single grab or a composite? What depth? How long between collection and analysis? Each answer affects interpretation substantially. Sound contaminant analysis treats the concentration figure as one input among several rather than as a standalone verdict, and conclusions about risk or compliance should involve qualified professionals.
How does unit selection affect scientific communication?
This effect is well documented in risk-communication research. Responsible scientific reporting selects units for clarity rather than impact, and states the reasoning where the choice might matter. Providing both expressions, as in “0.5 ppm (500 ppb)”, eliminates ambiguity entirely and costs only a few characters in any chemical reporting document.
Case Study: The Method Change
A long-running groundwater programme reported a particular solvent as non-detect for six consecutive years. In the seventh year the laboratory upgraded its instrumentation, lowering the detection limit from 5 ppb to 0.2 ppb. Results immediately showed detections around 1.5 ppb, prompting concern about a new release. Review of the method documentation revealed the concentration had almost certainly been present throughout, sitting below the previous detection limit. No environmental change had occurred; only the ability to measure it had improved.
Conclusion
You now understand what chemical concentration ppb figures represent and how they function within analytical and environmental reporting. The unit reflects the measurement range, not the substance or its significance.